Coinbase Global | #04
This Week's Most Undervalued Stock is Coinbase Global, Inc.
Welcome back to Closingbell Gems #04.
Before we jump in 👇
Join our new Trading Community.
Well, we just launched our NEW Discord Trading Group.
This group will be an easy way to:
✅ Get insights on trending Stock, NFT, and Crypto picks
✅ Get Free Alpha from other professional, semi-professional, and amateur traders.
✅ Learn about new investment opportunities, industries, and asset classes
✅ Meet other investors and traders
It’s free (for now 😏) - SO…you should join the community as we build it from scratch! Get in on the ground floor.
👀 How did we find this week’s stock
Coinbase doesn’t have much momentum in regards to its stock price.
But we wanted to cover it since there have been a number of generous tailwinds in the Cryptocurrency space over the past 24 months.
We thought Coinbase would be interesting too many of you who hold both asset classes.
Here is the exact search we ran across 6500+ US companies in Closingbell Pro. It produced 1965 results.
Coinbase was among the most undervalued companies in the Software and Services sector.
Now onto Coinbase 👇
Coinbase Global, Inc
Coinbase Global, Inc has a Closingbell Valuation Index of 15% making it relatively undervalued against its peers.
Coinbase’s peers are considered the constituents of the Software and Services GICS group.
📈 Price Forecast by Analysts
On the Closingbell App, the 17 analysts offering price forecasts for Coinbase have a median target of $313.40.
The median estimate represents a +131.91% upside from the current price.
📰 Recent Headlines
About Coinbase
Founded in 2012, Coinbase is the leading cryptocurrency exchange platform in the United States.
Users can establish an account directly with the firm, instead of using an intermediary, and many choose to allow Coinbase to act as a custodian for their cryptocurrency, giving the company breadth beyond that of a traditional financial exchange.
While the company still generates the majority of its revenue from transaction fees charged to its retail customers, Coinbase uses internal investment and acquisitions to expand into adjacent businesses, such as prime brokerage, data analytics, and collateralized lending.
Coinbase is building a more fair, accessible, efficient, and transparent financial system enabled by crypto.
The company started in 2012 with the radical idea that anyone, anywhere, should be able to easily and securely send and receive Bitcoin.
The company intends to be the safe and regulation-compliant point of entry for retail investors and institutions into the cryptocurrency economy.
About the CEO
Brian Armstrong is our co-founder and has served as our Chief Executive Officer and a member of our Board of Directors since our inception in May 2012 and as Chairman of our Board of Directors since February 2021.
Before our founding, Mr. Armstrong served as a software engineer at Airbnb, Inc., an online marketplace company, from May 2011 to June 2012.
From August 2003 to May 2012, Mr. Armstrong served as the founder and Chief Executive Officer of Universitytutor.com, an online tutoring directory.
Mr. Armstrong also previously served as a consultant for the enterprise risk management division at Deloitte & Touche LLP, an accounting and consulting firm, from July 2005 to November 2005.
In January 2020, Mr. Armstrong founded ResearchHub Technologies, Inc., a scientific research development platform, where he currently serves as Chief Executive Officer and a member of the board of directors.
In December 2021, Mr. Armstrong co-founded NewLimit, Inc., a healthcare research company, where he is an investor and a member of the board of directors. Mr. Armstrong holds a B.A. in Computer Science and Economics and an M.S. in Computer Science from Rice University.
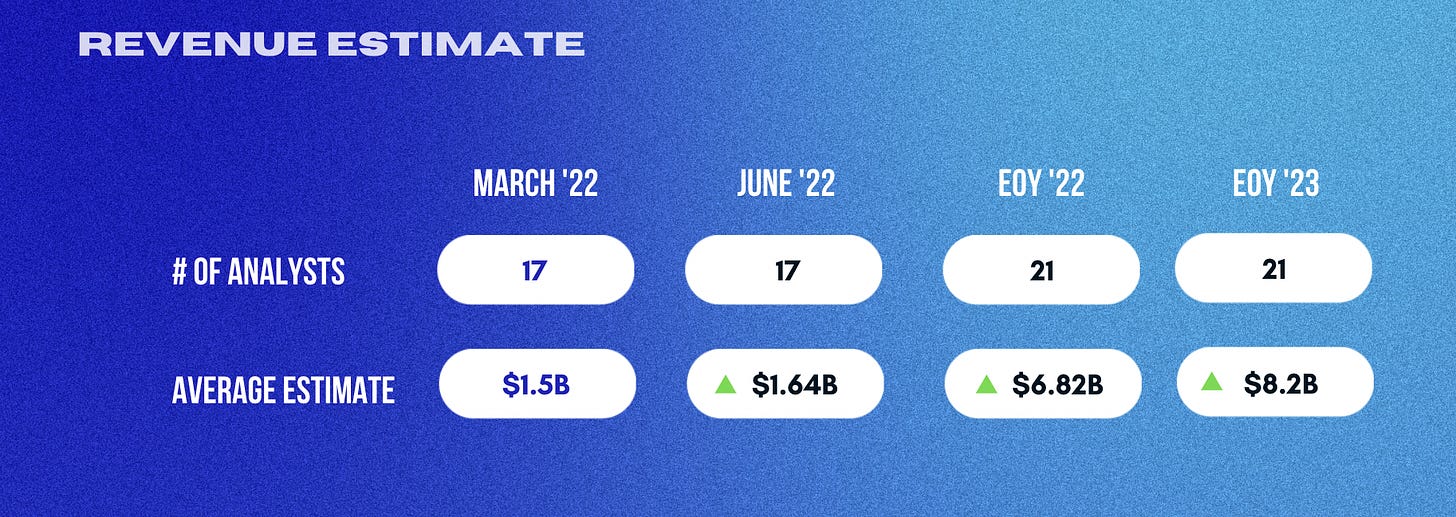
Revenue Forecasts
Fundamentals
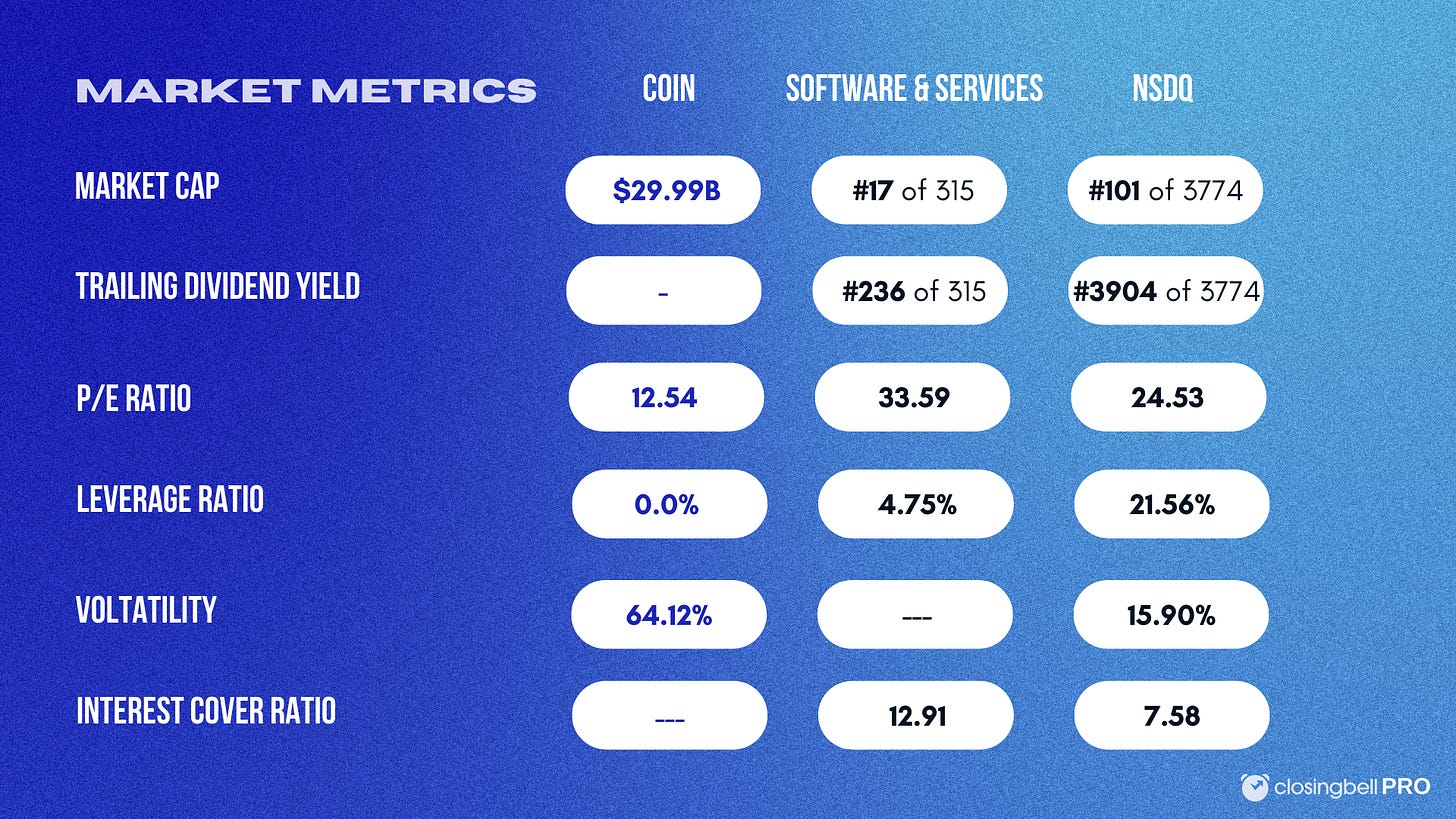
✅ COIN beat both: (a) the Software and Services Industry and (b) NSDQ Co’s across 7 key fundamental metrics
❌ COIN had no Trailing Dividend Yield
❌ COIN has a worse Price to Revenue than the Market.
Market Metrics
✅ COIN beat both: (a) the Software and Services Industry and (b) NSDQ Co’s P/E Ratio.
❌ COIN is more volatile than the Market
If you’d like to learn more, we’ve included an Appendix with definitions of each of these metrics.
You should weigh in 🥊
Head over to Closingbell to Discuss COIN:
Post a rating with your opinion about COIN 🧠 Is it a buy, sell or hold? Why do you think that?
Want access to rich investing data?
Do you like the content inside this email?
Get rich valuation, sentiment, financial, and social media data on 8000+ companies for only U$15/m.
If you’d like to trial Closingbell Pro you can do so by booking a time so we can show you the platform and set you up with an account.
Lastly, what’s trending right now?
Thanks for taking the time to read this! See you next week.
Regards,
Luca
CEO, Closingbell
For behind the scenes action, follow along here: twitter.com/lucamonk
Appendix: Metric Definitions
👉 Earnings Yield: A percentage measure of the return the company is making, based on its after-tax earnings and the current share price. Calculated as earnings per share divided by the price per share. Higher earnings yields can be interpreted as representing higher returns for an investment at the current share price.
👉 Trailing Dividend Yield: Your annual income from your investment in the company. Indicated yield represents trailing total annual dividends divided by current stock price.
👉 Price to Book Ratio: This ratio describes the relationship between the share price and the company's contributed accounting equity (plus retained earnings). Calculated as the price per share divided by the book value of equity per share. Other factors being equal, a lower price to book ratio can indicate a more attractive investment, according to some investors.
👉 Price to EBITDA Ratio: This ratio describes the relationship between the share price and the company's contributed accounting equity (plus retained earnings). Calculated as the price per share divided by the book value of equity per share. Other factors being equal, a lower price to book ratio can indicate a more attractive investment, according to some investors.
👉 Return on Assets: A measure of how productive the company's assets are in producing its earnings. Calculated as the earnings divided by the book value of assets of the company. A higher return on assets is often thought by investors to indicate a more efficient and profitable company.
👉 Price to Cashflow: A measure of the current share price as a percentage of the cash flow per share generated by the company. Calculated as cash flow per share divided by the current market price per share. A lower ratio is often thought to represent a more attractive investment by some investors.
👉 Return on Equity: A measure of how productive the company's contributed equity is in producing its profit. Calculated as earnings divided by the book value of equity of the company. A higher return on equity is often thought by investors to indicate a more profitable company.
👉 Price to Revenue: A measure of the price per share of the company as a percentage of its revenue per share. Calculated as share price divided by revenue. A lower ratio is often thought to represent a more attractive investment by some investors.
👉 Enterprise Value to EBIDTA: This ratio expresses the Enterprise Value of a company, which is the market value of equity plus total debt minus cash, divided by the pre-tax earnings before adjustments for interest, depreciation, and amortization. It represents the total value if the business as a multiple of its EBITDA, and a higher ratio is often thought to offer a relatively more attractive investment by some investors.
👉 P/E Ratio: Current stock price divided by trailing annual earnings per share. If a stock sells for $25.50 per share and has earned $2.55 per share this year, then it has a trailing P/E ratio of 10 ($25.50 / $2.55 = 10). This means the stock is currently selling for ten times its earnings. Other factors being equal, investors may regard companies with lower P/Es to be relatively less expensive.
👉 Leverage Ratio: A measure of the amount of debt the company has divided by the market value of its equity plus its debt (less cash), or enterprise value. Other factors being equal, lower leverage in a company's capital structure can mean lower financial risk for investors.
👉 Volatility: Investors may often use this as a measure of an asset's absolute investment risk. Calculated as the annual standard deviation of the percentage daily price changes. The higher the volatility, the more the share price moves up and down, and the more uncertain (riskier) returns may be.
👉 Interest Cover Ratio: A measure of the company's earnings relative to the cost of its debt. Calculated as the cash operating earnings before interest and tax divided by the annual interest expense. A higher number can indicate the company is in a better position to service its debt under different scenarios.
Disclaimer: The information that Closingbell provides is general in nature as it has been prepared without taking account of your objectives, financial situation or needs. It does not constitute a recommendation to buy or sell any stock. This email is not intended as legal, financial or investment advice and should not be construed or relied on as such. Closingbell is not responsible for any damages. Before making any commitment of a legal or financial nature you should seek advice from a qualified and registered legal practitioner or financial or investment adviser. Note that our analysis may not factor in the latest price-sensitive company announcements or qualitative material. Closingbell has no position in any stocks mentioned.


