The Kraft Heinz Co | #06
This Week's Most Undervalued Stock is The Kraft Heinz Co.
Welcome back to Closingbell Gems #06. This week we cover Kraft Heinz.
A few things before we get started 👇
Join our new Trading Community.
We just launched our NEW Discord Trading Group.
This group will be an easy way to:
✅ Get insights on trending Stock, NFT, and Crypto picks
✅ Get Free Alpha from other credible traders.
✅ Learn about new investment opportunities, industries, and asset classes
✅ Meet other investors and traders
It’s free, so you should join the community as we build it from scratch! Get in on the ground floor.
What’s trending right now on Closingbell?
Top 6 are: COIN, UPST, SPLK, GME, UBER and TWTR.
Now onto Kraft Heinz 👇
Kraft Heinz (KHC)
Kraft Heinz has a Closingbell Valuation Index of 32% making it relatively undervalued against its peers.
Kraft Heinz's peers are considered the constituents of the Food, Beverage, and Tobacco GICS group.
About Kraft Heinz
In July 2015, Kraft merged with Heinz to create the third-largest food and beverage manufacturer in North America behind PepsiCo and Nestle and the fifth-largest player in the world.
Beyond its namesake brands, the combined firm's portfolio includes Oscar Mayer, Velveeta, and Philadelphia. Outside North America, the firm's global reach includes a distribution network in Europe and emerging markets that drive around one fifth of its consolidated sales base, as its products are sold in more than 190 countries and territories.
The Kraft Heinz Company is driving transformation, inspired by its Purpose, Let's Make Life Delicious. Consumers are at the center of everything the company does. With 2020 net sales of approximately $26 billion, Kraft Heinz is committed to growing its iconic and emerging food and beverage brands on a global scale.
The company leverages its scale and agility to unleash the full power of Kraft Heinz across a portfolio of six consumer-driven product platforms. As global citizens, the company is dedicated to making a sustainable, ethical impact while helping feed the world in healthy, responsible ways.
📈 Price Forecast by Analysts
The 19 analysts offering 12-month price forecasts for Kraft Heinz Co have a median target of 45.00, with a high estimate of 48.00 and a low estimate of 37.00. The median estimate represents a +1.63% increase from the last price of 44.28.
The current consensus among 22 polled investment analysts is to hold stock in Kraft Heinz Co. This rating has held steady since May, when it was unchanged from a hold rating.
📰 Recent Headlines
Insider Buys
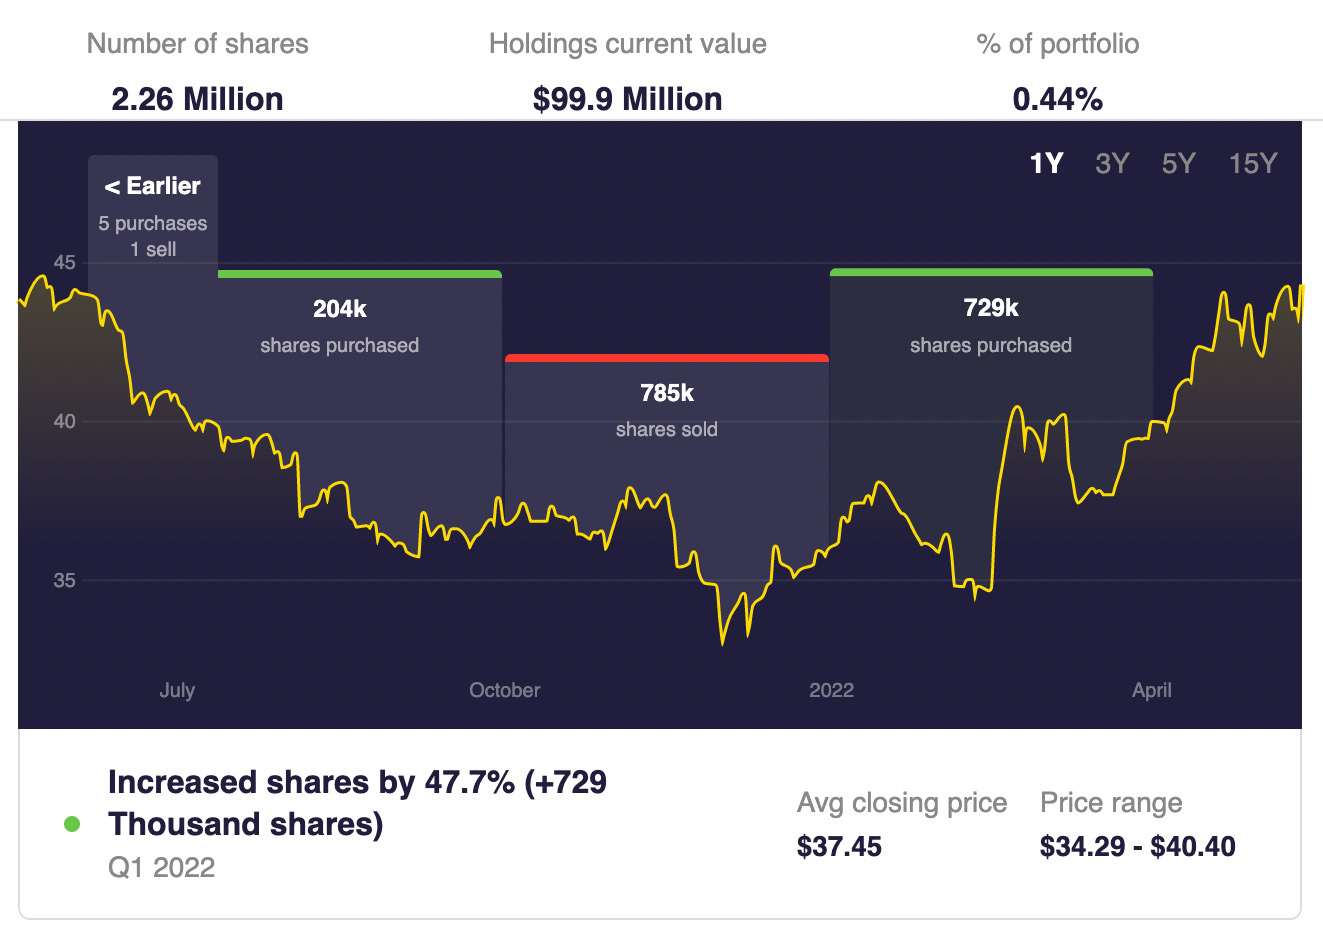
Ray Dalio (Bridgewater Associated) is buying Kraft Heinz. While he only holds a small portion of his portfolio (0.44%), he has recently increased his shares by 47.7% (+729k shares) in Q1 2022 at an average closing price of $37.45.
Quarterly Financials
KHC saw Year-over-Year improvements across:
✅ Net Income
✅ Diluted EPS
✅ Net Profit Margin
Fundamentals
✅ KHC beat both: (a) the Food, Beverage and Tabacco and (b) NSDQ Co’s across 6 key fundamental metrics
❌ KHC has a worse Return on Assets and Return on Equity than the Market.
Market Metrics
✅ KHC beat both: (a) the Food, Beverage, and Tobacco and (b) NSDQ Co’s across P/E Ratio
❌ KHC is more volatile than the Market
❌ KHC has a marginally higher leverage ratio than the industry and Market
❌ KHC has a lower interest cover ratio than the industry and the Market
If you’d like to learn more, we’ve included an Appendix with definitions of each of these metrics.
You should weigh in 🥊
Head over to Closingbell to Discuss KHC:
Post a rating with your opinion about KHC 🧠 Is it a buy, sell or hold? Why do you think that?
Thanks for taking the time to read this! See you next week.
Regards,
Luca
CEO, Closingbell
For behind the scenes action, follow along here: twitter.com/lucamonk
Appendix: Metric Definitions
👉 Earnings Yield: A percentage measure of the return the company is making, based on its after-tax earnings and the current share price. Calculated as earnings per share divided by the price per share. Higher earnings yields can be interpreted as representing higher returns for an investment at the current share price.
👉 Trailing Dividend Yield: Your annual income from your investment in the company. Indicated yield represents trailing total annual dividends divided by current stock price.
👉 Price to Book Ratio: This ratio describes the relationship between the share price and the company's contributed accounting equity (plus retained earnings). Calculated as the price per share divided by the book value of equity per share. Other factors being equal, a lower price to book ratio can indicate a more attractive investment, according to some investors.
👉 Price to EBITDA Ratio: This ratio describes the relationship between the share price and the company's contributed accounting equity (plus retained earnings). Calculated as the price per share divided by the book value of equity per share. Other factors being equal, a lower price to book ratio can indicate a more attractive investment, according to some investors.
👉 Return on Assets: A measure of how productive the company's assets are in producing its earnings. Calculated as the earnings divided by the book value of assets of the company. A higher return on assets is often thought by investors to indicate a more efficient and profitable company.
👉 Price to Cashflow: A measure of the current share price as a percentage of the cash flow per share generated by the company. Calculated as cash flow per share divided by the current market price per share. A lower ratio is often thought to represent a more attractive investment by some investors.
👉 Return on Equity: A measure of how productive the company's contributed equity is in producing its profit. Calculated as earnings divided by the book value of equity of the company. A higher return on equity is often thought by investors to indicate a more profitable company.
👉 Price to Revenue: A measure of the price per share of the company as a percentage of its revenue per share. Calculated as share price divided by revenue. A lower ratio is often thought to represent a more attractive investment by some investors.
👉 Enterprise Value to EBIDTA: This ratio expresses the Enterprise Value of a company, which is the market value of equity plus total debt minus cash, divided by the pre-tax earnings before adjustments for interest, depreciation, and amortization. It represents the total value if the business as a multiple of its EBITDA, and a higher ratio is often thought to offer a relatively more attractive investment by some investors.
👉 P/E Ratio: Current stock price divided by trailing annual earnings per share. If a stock sells for $25.50 per share and has earned $2.55 per share this year, then it has a trailing P/E ratio of 10 ($25.50 / $2.55 = 10). This means the stock is currently selling for ten times its earnings. Other factors being equal, investors may regard companies with lower P/Es to be relatively less expensive.
👉 Leverage Ratio: A measure of the amount of debt the company has divided by the market value of its equity plus its debt (less cash), or enterprise value. Other factors being equal, lower leverage in a company's capital structure can mean lower financial risk for investors.
👉 Volatility: Investors may often use this as a measure of an asset's absolute investment risk. Calculated as the annual standard deviation of the percentage daily price changes. The higher the volatility, the more the share price moves up and down, and the more uncertain (riskier) returns may be.
👉 Interest Cover Ratio: A measure of the company's earnings relative to the cost of its debt. Calculated as the cash operating earnings before interest and tax divided by the annual interest expense. A higher number can indicate the company is in a better position to service its debt under different scenarios.
Disclaimer: The information that Closingbell provides is general in nature as it has been prepared without taking account of your objectives, financial situation or needs. It does not constitute a recommendation to buy or sell any stock. This email is not intended as legal, financial or investment advice and should not be construed or relied on as such. Closingbell is not responsible for any damages. Before making any commitment of a legal or financial nature you should seek advice from a qualified and registered legal practitioner or financial or investment adviser. Note that our analysis may not factor in the latest price-sensitive company announcements or qualitative material. Closingbell has no position in any stocks mentioned.


